
Capturing and sharing accurate train consist information:
‘iLIDS’ stands for ‘Interactive Locations and Intelligent Digital Signage’. It is part of the Department for Transport’s £9m Innovate UK ‘Accelerating Innovation in Rail’ programme under which Enable iD, The Rail Safety and Standards Board (RSSB), Arriva UK Trains and research partners the University of Surrey are researching, developing and testing new technology to improve information, safety and accessibility on railway station platforms.
Background to the Research
This summer project continued the train consist work that was started as part of the RSSB funded competition “Faster, Safer, Better Boarding and Alighting”. As part of the original project “Using real-time data on train consist and loading to influence passenger positioning and boarding behaviour at the PTI“, the University of Surrey project team was responsible for producing a prototype application to demonstrate the feasibility of determining the train consist using a low-cost IoT device, in this case, an Orange Pi (http://www.orangepi.org/). The main issue was the reliability and accuracy of the obtained data which was about 60%. The relative low accuracy was due to only one IoT device being deployed which resulted in some missed coaches for fast- moving trains or additional coaches being reported when two trains passed each other when travelling past the device. An additional drawback of the original solution was the requirement for mains power and availability of an internet connection provided by a 3G mobile modem.
Since the iLIDS project is highly dependent on accurate train consist data being available, one way of addressing this data need is to provide it as part of the overall solution at stations which deploy the iLIDS solution. The summer project aimed to provide a more accurate, cheaper and mobile network-independent solution to the train consist problem.
Existing Approach
In the original approach, the following diagram summarised the different components:

Figure 1: Train consist architecture
The scanning device (an Orange PI running Android and some bespoke scanning software developed for the project) would scan for known Service Set IDentifiers(SSIDs), eg “_Chiltern-wifi” or “GWR WiFi” and look for the Media Access Control(MAC) address of the corresponding Access Point(AP). This MAC address together with some metadata (eg date/time, signal strength) is then sent via the mobile network to a web service. This web service then uses the provided information to map it to a serial number of the coach in which the AP is installed. The serial number which is unique is then used to determine the facilities available by consulting the Rolling Stock library. The signal strength and timestamps associated with the various MAC addresses are used to provide an estimate for the train consist which was then visualised on a web page:
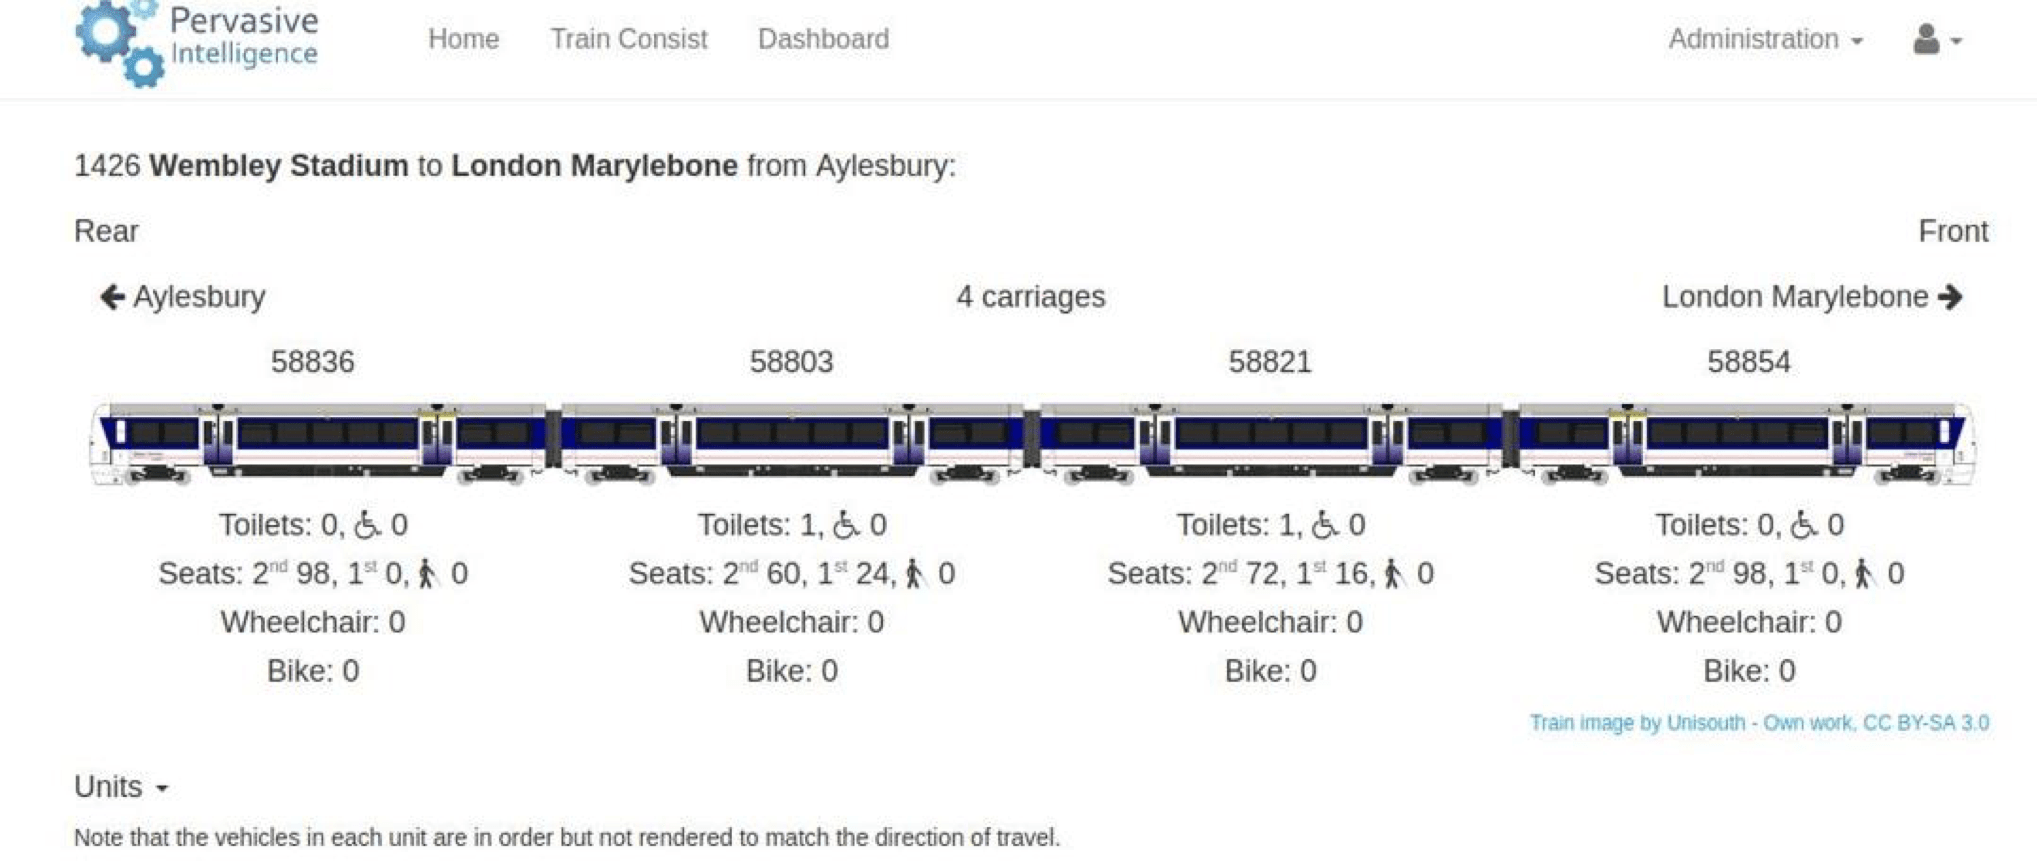
Figure 2: Visualisation of Train Consist
While almost all (95%) vehicles with modern WIFI hardware were picked up, due to just using one scanner, only 60% of consists were accurately calculated in real-time. Another drawback of the prototype was its reliance of mobile networks to provide internet access and, due to its power consumption, a requirement for at least a USB-port providing around 500mA.
New Approach
The following areas needed to be addressed:
1. Accuracy
2. Dependency on mobile network
3. Dependency on a power supply
The last 2 aspects were addressed by switching from a high-specification IoT device like the Orange PI to a simpler device like the PyCom IoT device (https://pycom.io/hardware/lopy-specs/). These devices are designed to be low-powered and are supposed to run for months or even years on a battery. Moreover, they offer WIFI scanning as well as being able to join or create (if necessary) a Low-Power Wide Area Network (LPWAN) which uses unlicensed spectrum to transmit their data. The distances that can be covered range from a few kilometres ( in urban areas) to 40 or more kilometres in rural areas.
Since these devices do not need to transmit any data other than their WIFI scans, the speed limitation of the LPWAN is less of a concern.
The accuracy of the scanned data is improved by deploying multiple scanners sufficiently far enough apart to ensure that multiple trains passing a sensor are unlikely to still be passing each other at the next sensor.
The following diagram shows the deployment of the two sensors and an LPWAN gateway on our campus :
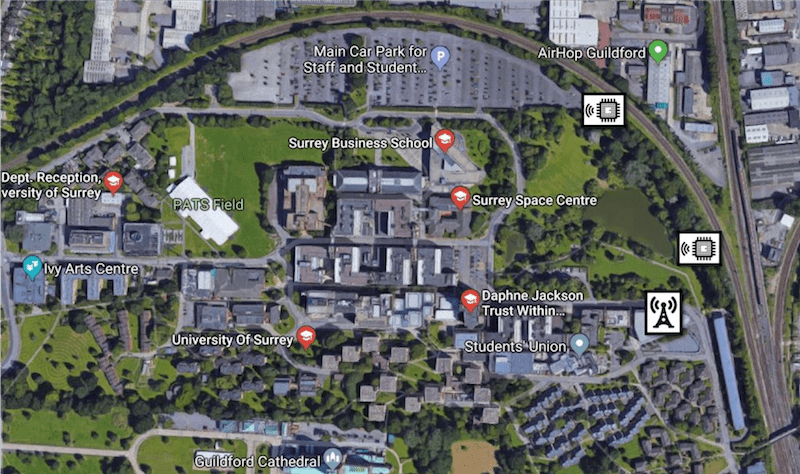
Figure 3: LoPy Sensor and gateway deployment
The sensors were placed alongside the rail track of the Guildford<->Reading and Guildford<->Ascot trains. The first sensor was placed furthest away from Guildford station and could only “see” the 2 tracks going passed it. The second sensor was placed closer to Guildford station and actually “overlooked” not only the Reading/Ascot track but also some additional tracks used by the London and Portsmouth bound trains.
The LoPy Sensors formed their own LPWAN network by sending their data to a nano gateway (provided by an additional LoPy IoT device which was configured to act as a gateway, ie it was connected to the internet and transmitted the received data to the web service for further analysis). This nano gateway was placed inside the Duke of Kent building. The distances between it and the furthest sensors were about 250m. The university also runs its own LoRa gateway but that was unfortunately unavailable over the summer.
Challenges
Moving from a powerful platform (Orange Pi) to the lower specified PyCom board brought several challenges that needed to be overcome. The main challenges included:
- The default WIFI scanning rate of the PyCom boards is limited to about one scan every 4s which resulted in poor performance as the train carriages passed too quickly for all the APs to be picked up. This required a modification of the firmware to reduce the scan cycle to a more reasonable 300ms.
- The number of potential WIFI channels is 13 for the 802 b/g/n/a WIFI standard and if they were all used then cycling through them would require almost 5s. However, the trains in questions were using only a limited number of channels (1,6 and 11). Consequently, the software limited its scanning to those channels and thereby reducing the scan time for these 3 channels to about 1s.
- Due to the nature of the LPWAN LoRa network, the devices are limited in how much data they can send and therefore each device performed some initial analysis on their captured data and only submitted a reduced data set which contained its version of the train consist. The server-side would then use this information and attempt to resolve any conflicts or ambiguities.
- The initial plan was to connect to an existing LoRa gateway operated on the University of Surrey’s campus. Unfortunately, this gateway was out of operation during the whole of the summer and meant that the project needed to use the PyCom boards and operate its own “nano” gateway. This meant that the LPWAN LoRa network coverage was limited to about 250m line of sight rather than the expected 1 to 30km. However, it demonstrated that even when there is no existing LoRa network coverage, it can be provided by simply using one or more PyCom boards to work as nano gateways.
Outcomes
Having 2 sensors provided the desired boost in accuracy. The sensors were able to determine correctly the direction of travel using the time stamps of when the APs passed the sensor. Moreover, crossing trains could be disambiguated using these multiple sensors.
Unfortunately, while the PyCom boards were battery-powered, their power consumption has not yet been captured precisely. Moreover, there are additional power optimisations that can be made to ensure that the boards minimise their power consumption when no trains are passing.
Conclusion and Future Work
The summer project proved that moving to the PyCom boards addressed most of the shortcomings of the original architecture: accuracy, reliance on mobile networks and main power supply.
However, more data will need to be captured to improve the accuracy further and hopefully, the trial at MCO will provide the opportunity. Additionally, the power consumption of these devices needs to be established to determine how long they can operate on one battery charge and whether small solar panels should be fitted to top up the battery during the day.
The summer interns presented their work to representatives of RDG who were very keen to explore the use of this technology further and potentially use the data produced as a feed into their Connecting Train Identifier project which aims to provide train consist data as part of the Darwin feed.
Author
Petar Zdravkov, born and raised in Bulgaria, is a Computer Science student at the University of Surrey, currently doing his placement year in one of the world`s biggest agrochemical companies, working as a Software Developer in the company`s UK based R&D site.
From a talented artist with numerous awards from national art competitions, Petar changes his life-aspiration, from working as a 3D animation and graphics specialist to becoming a computer scientist. Being raised in a farmer`s home and his lifelong experience in agriculture production, helps him find his area of interest, more specific – digitalizing agricultural processes which allows him to focus on multiple areas of such as AI & Deep learning, Mobile and Web Applications development, as well as electrical engineering.

Petar gets his first IT job only after a year in university, despite having no previous knowledge or skills in programming or electrical engineering prior to the beginning of his study. At the end of his second year of study, he is recruited by the University of Surrey as a research assistant, working alongside his friend and classmate Emil Georgiev, on proving that reliable data about train consists can be obtained in real-time using low-powered wi-fi scanning devices. During his participation in the project, he successfully delivers a working prototype of a web-application, capable of extracting data collected by multiple devices from an IoT cloud server, validating the data sets and representing the final train consists sequences.


